Measuring a process’ memory in OS X/Linux

I found myself needing to measure the memory usage of a program
throughout its run time and was surprised that I didn’t find a tool out
there already that did what I wanted. After a bunch of work, I figured out
that it’s easy to roll it yourself. In the hope of saving somebody that
work in the future, here’s how to do it. This post describes how to run a
process, sample its memory throughout its run using only bash and unix
tools, and plot the results using gnuplot.
The process we’ll measure
In my case, I was measuring an ETL process, but this technique is equally applicable to any process on your system. For demonstration purposes, we need a meaningless process that takes a short while. The process we’ll measure is:
grep -ris "banana" /usr/bin
On my system, this process takes about four seconds and returns no results. This grep search has three flags:
-r: search recursively. This means that grep won’t stop at just searching the files in /usr/bin, but will search all subdirectories.-i: search case insensitively. I did this so the process would run a bit longer.-s: silent mode. This means nonexistent and unreadable files are ignored.
What is memory even? (A refresher)
On a modern OS, each process gets a virtual address space. This means it has access to a vast array of memory, which may or may not actually be stored on the RAM of the physical computer. The OS will, at its discretion, move memory pages from your process’ virtual memory into and out of physical RAM. One app may share memory with another; if two programs both load the same shared library, the OS will (probably, at its discretion) load only one copy into RAM.
There are two principal measurements1 of your program’s size, using this information:
Virtual size: The total virtual address space allocated to your program
Resident set size: The total memory space currently resident in RAM and associated with your program
The measurement we want is rss: the resident set size of the program
we’re studying.
ps
There are many tools to investigate a running program’s memory, but let’s
examine ps. Its main virtues are that it’s simple and it’s
available everywhere, in reasonably cross-platform fashion.
We can list the processes our user owns, sorted by memory: ps -m
That’s handy, but it doesn’t actually show memory usage, so let’s tell it to
show some columns: ps -m -o pid,vsz,rss,%mem,command
In this case, we’ve asked it to show us pid, the process id of
each displayed process; vsz, its virtual address size;
rss, its resident set size; %mem, the percent of
physical memory occupied by that process’ resident set; and
command, the full command that is running. The -o option to ps allows us to specify what columns we want to
display; look at the man page to see the full list of what’s available. The final piece we need is to limit this list by process id with the
-p flag.
Here’s a command to get the pid of the top memory-using process on our system: ps -o pid= | head -n12
Finally, we can use that to construct a command to print out the rss of the process we own that’s using the most memory: ps -o pid,vsz,rss,%mem,command -p \$(ps -m -o pid= | head -n1)3
Sampling
Now that we know how to measure a given process’ rss, we can go back to
our initial idea of measuring the memory usage of grep -ris "banana" /usr/bin. Let’s start writing a bash script:
#!/usr/bin/env bash
set -e
grep -ris "banana" /usr/bin &
pid=$!
ps -o rss -p $pid
This script does the following:
Tells the OS to use bash to run the script
Tells bash to quit if any command fails (
set -e)Runs the grep command we have previously talked about and puts it into the background (
&)Gets the process identifier (PID) of the most recent command put into the background (
\$!) and saves it to the variablepidPrints the grep’s memory usage using the PID we stored
That’s a great start!
To measure memory usage over time, we need to run that in a loop, limit the output a bit, and append to a file which stores the measured values. We’ll need a couple of tools for this:
date +%s: outputs the time in seconds since the epochprintf: bash’s super-handyprintffunctionmktemp: a unix tool that we’ll use to make a temporary file for our memory trace log
Here’s a script that starts the process, creates a log file, samples the memory size every tenth of a second, and saves it to the log:
Graphing
Now we have a logfile that contains two columns: seconds since program
start and memory usage in kB. To graph it, we’ll use the handy tool
gnuplot. It may not be the prettiest, but
it’s available everywhere and simple to use. The simplest gnuplot invocation that shows us a graph is: gnuplot -p -e "plot \"\$logfile\" with lines"
-p:leave the graph showing after gnuplot exits-e:run this plotting script; here we tell it to make a line graph from our logfile, and it complies
We can also pass gnuplot a longer script on stdin; here we use it to show a graph in our console by adding this command to the bottom of our script:
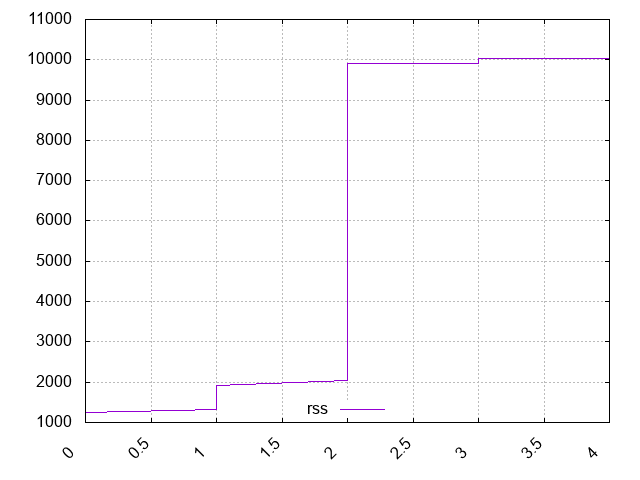
gnuplot <<EOF
set terminal dumb
set key off
set offset graph 0, 0, 0.10, 0.10
set tics out
plot "$logfile" with lines
EOF
Here we can clearly see that grep’s memory usage starts at about 2kB and jumps to about 1MB at the 2 second mark. Not bad for a short script!
We can also output a fancier graph. Here’s a gnuplot script that will output a PNG graph:
Customize the graph to your heart’s content using the gnuplot documentation.
Conclusion
That’s a brief trip into how we can use bash and
gnuplot to trace and show a graph of a process’ memory usage
throughout its lifetime. I hope you learned a trick or two.
Footnotes
1: On Linux there is a measurement called Proportional Set Size which attempts to factor out the shared space used by your program. If
programs A and B have private memory of 500MB and share a 200MB library, the
PSS will be 600MB for each. Mac does not really have this measurement, though
you can mostly figure it out using
vmmap
2: The equals following the output specifier tells ps not to
print the header. From the BSD man page:
Keywords may be appended with an equals (
=) sign and a string. This causes the printed header to use the specified string instead of the standard header. If all keywords have empty header texts, no header line is written.
3: Yes, we could sort by memory and head the output, but
we’re going to need to specify a process ID later.