CPU profiling with Qcachegrind
Following is a presentation I made to my engineering colleagues at Ad Hoc about CPU profiling with qcachegrind, a tool that allows visualisation of profiling data in the callgrind format.
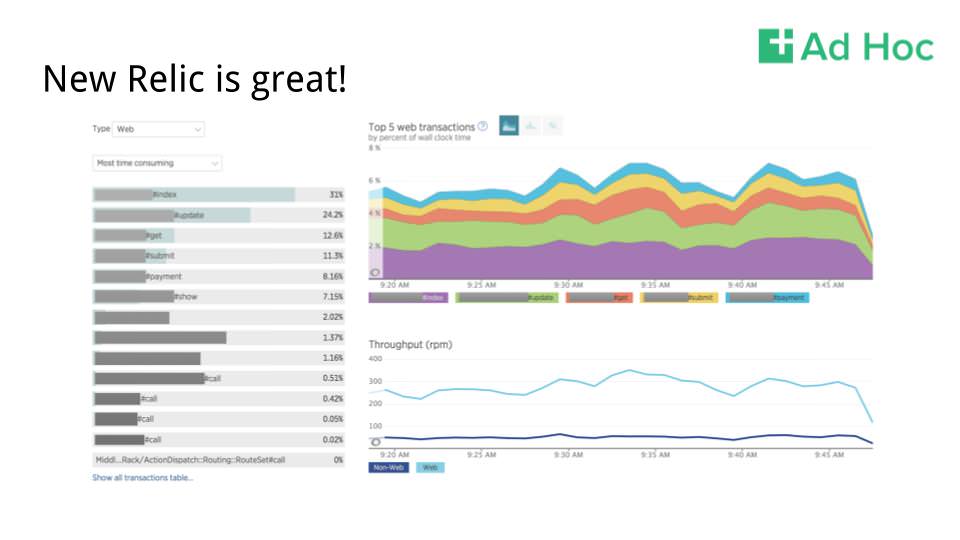
New Relic is a great tool to get the lay of the land and start seeing slow out what requests are slow in your application.
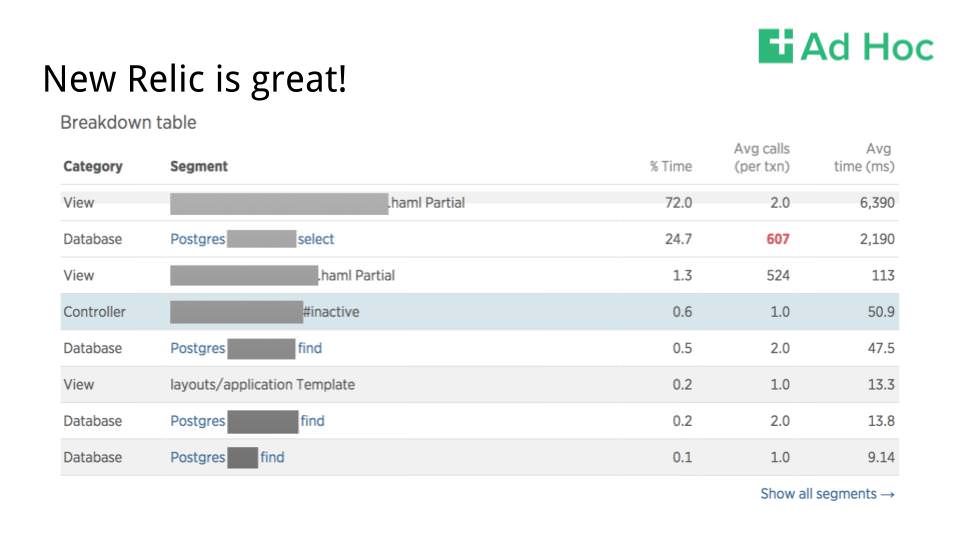
New Relic can also even give you some visibility into which operations in a given request are slow. Sometimes, those slow bits are really obvious, and New Relic can help surface the low-hanging fruit when it comes to performance optimization.
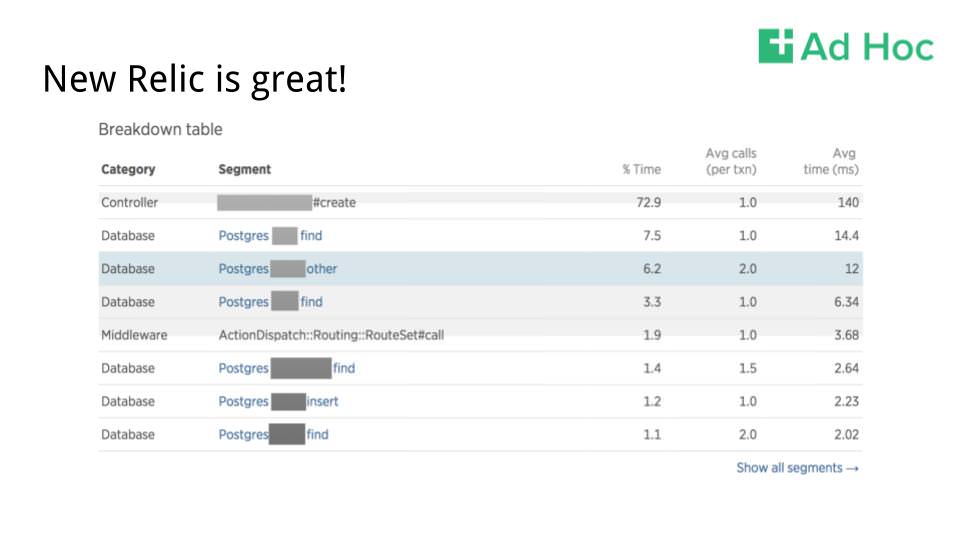
But what happens when you reach the granularity limits of New Relic? Once you’ve picked all of that low-hanging fruit, where do you turn if you need further tuning?
Let’s take a step back and get some background out of the way. A call graph is a handy way of representing a computer program as a directed graph, whereby given function calls are represented as the nodes in the graph, and the edges between the nodes represent calls between functions.
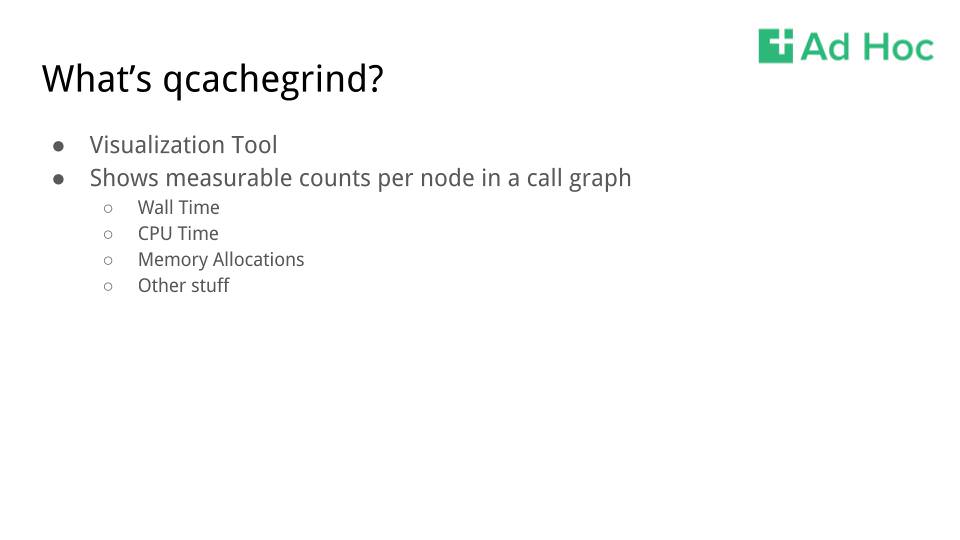
QCacheGrind is part of the [valgrind suite of tools](http://valgrind.org/info/tools.html. Valgrind started out as a set of tools to do memory profiling, mostly of C programs. A file format, callgrind, was developed in order to store and analyze the output from valgrind. Qcachegrind, also known as kcachegrind (because it started out as a KDE program on Linux), was developed as a means to visualize callgrind files. As it turns out, callgrind is a really good format for representing arbitrary counts of things attached to nodes and edges in a call graph, for example, wall time, CPU time, or memory allocations.
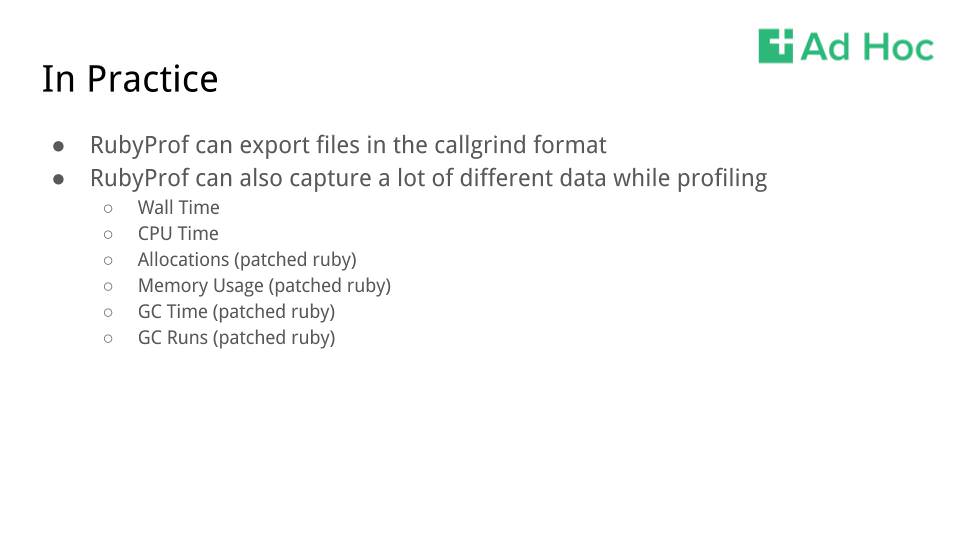
To get a little more concrete, RubyProf (as well as profiling tools for a lot of other languages!) supports outputting to callgrind files. RubyProf can capture a bunch of things out of the gate, like Wall Time and CPU time, and if you are running a patched version of ruby, it can also capture memory allocations and usage, as well as garbage collection time and number of runs.
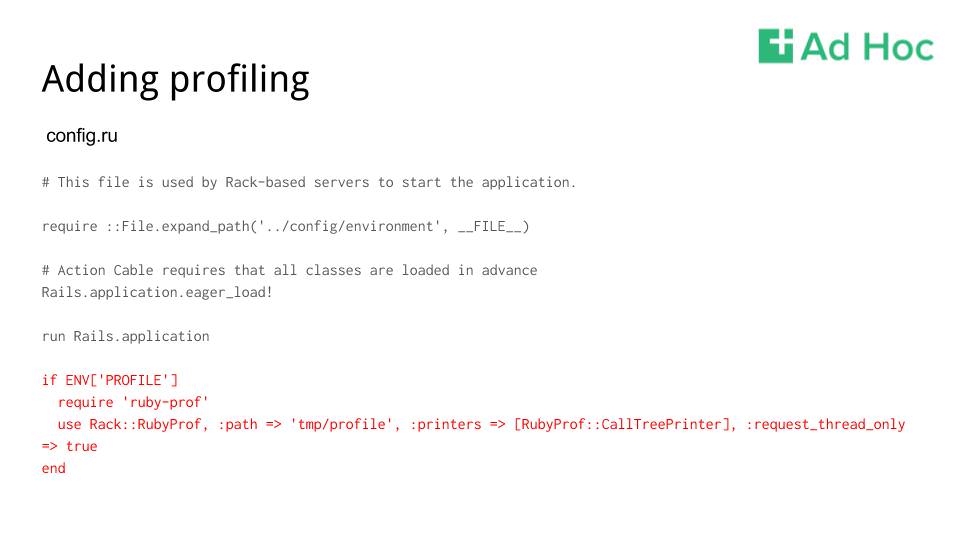
Getting a simple implementation of rubyprof in place is a cinch. After adding the gem to your Gemfile, you can easily enable it via an environment variable. Here, we’re using the PROFILE environment variable to turn on rubyprof’s provided piece of rack middleware to capture Rails requests in the config.ru file. Specifically, we’re going to use the CallTreePrinter to output callgrind files, and we’re only going to capture the request thread, since Rails uses Puma by default now, which is a multi-threaded server. Implicitly, we’re also going to capture wall time, since that’s the RubyProf default and it’s a fairly good first measure to capture.
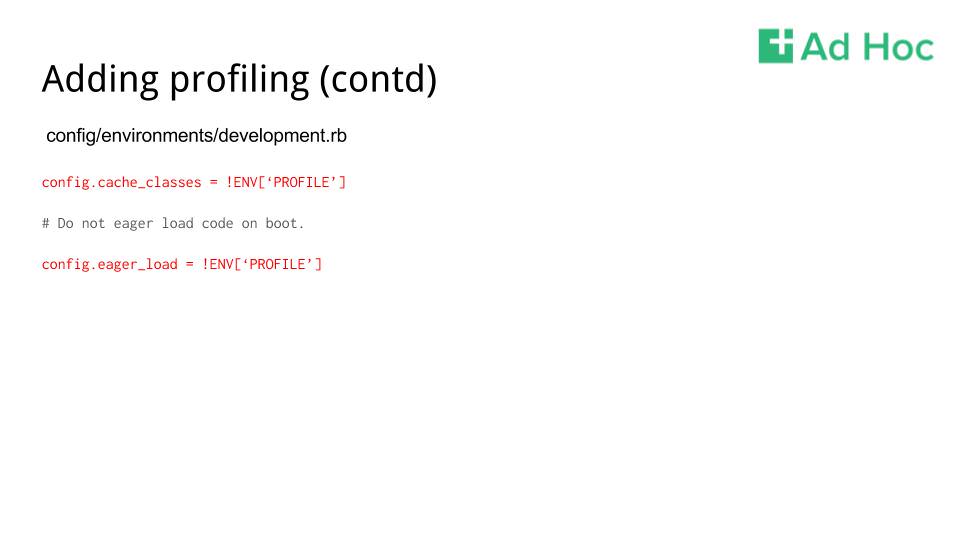
We also have another couple wrinkles for running in the Rails development environment. We want to make sure we cache classes and enable eager loading so that our profiling output isn’t polluted with traces of a bunch of the Rails code- reloading functionality. Here, we’re making sure to enable both the options, but only if the PROFILE environment variable is set.
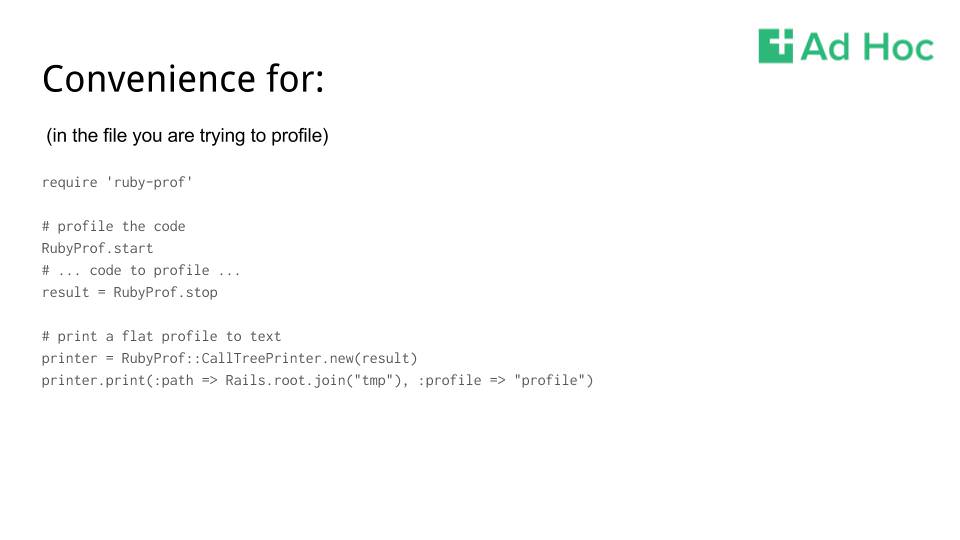
This middleware is really just a convenience wrapper for starting and stopping profiling, and dumping that output to a callgrind file via a RubyProf printer. This approach is useful if you want to target particular pieces of code

So what do you get when you open the output in qcachegrind?
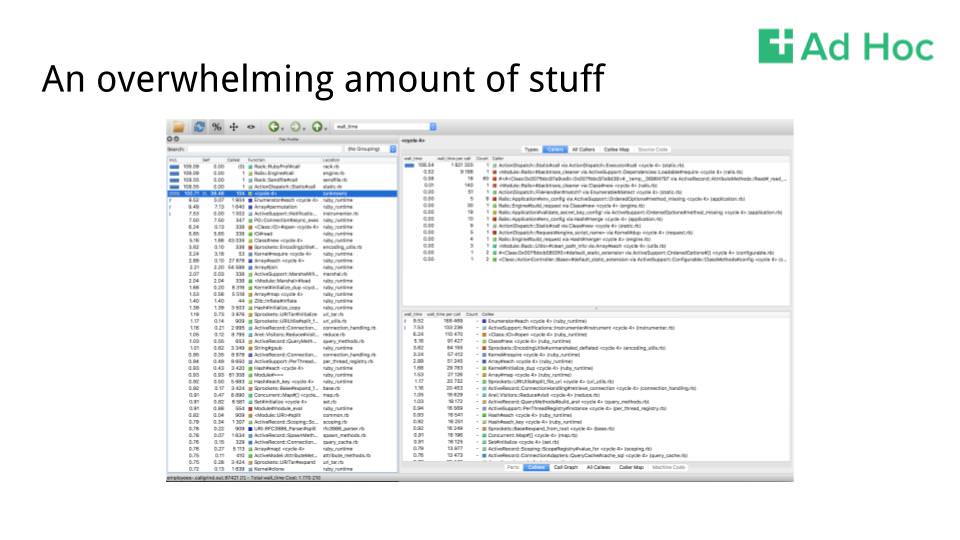
Total, unadulterated, information overload. Let’s break down some of the more useful bits.
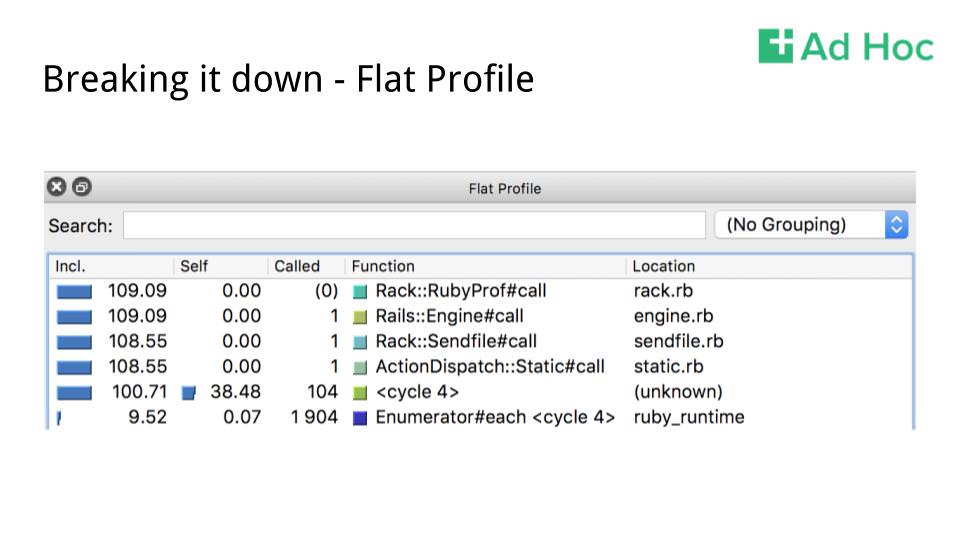
The flat profile lets you see a few useful things. Each node in the graph is a row. The Inclusive column is the total count of (in this case) wall time for a given node and all the nodes it links to. The Self column is the time spent just in the node. Called is the number of times that the node was visited (or called) during execution. Grouping lets you roll up this list by source file, class, or function cycle.
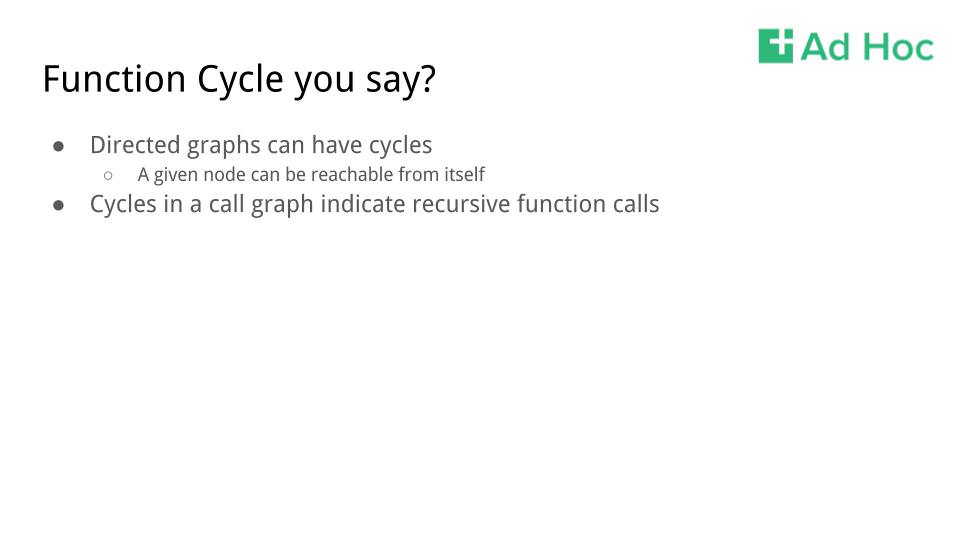
An attribute of a directed graph, unless it’s specifically an acyclic graph, is that it can have cycles. All this means is that a given node is reachable from itself. What does this mean in a call graph? It means that your program has some level of recursive function calls. Qcachegrind has cycle detection baked in, so it can help point out where you may have unintentional recursion in your program.
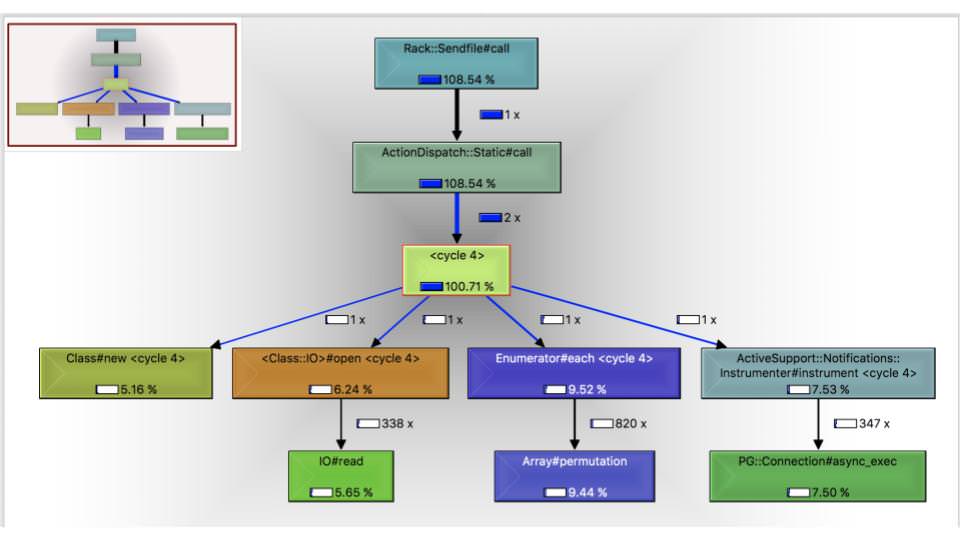
As promised, here’s a call graph. The numbers attached to the edges are call counts and the percentages inside the nodes are the inclusive percentage of wall time spent in that node and its children. Something to keep in mind is that any nodes that are under a certain percentage of wall time get filtered out, so don’t expect things to add up to 100% Also, because this is sampled data and can occur in multiple threads, numbers above 100% are possible. We’ve got a few things going on here: we’re spending a lot of time on IO, running database queries, and looping through enumerables. Let’s drill down into the query specifically.
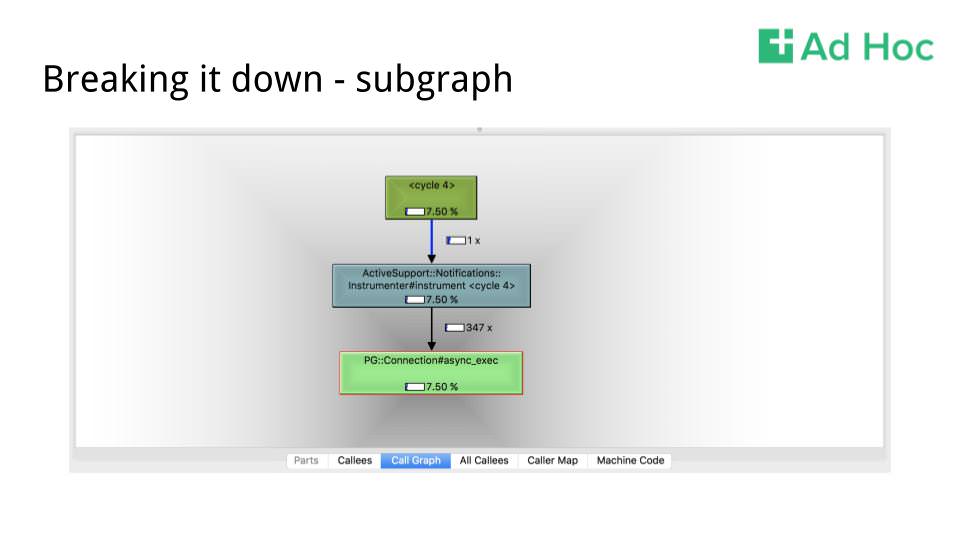
We’ve learned a couple things here:
- We’re spending 7.5% of our time on database queries
- We’re making 347 queries here So we’ve surfaced something suboptimal that’s beneath New Relic’s threshold right off the bat. We might not be spending a ton of time running queries in an absolute sense, but how much garbage are we generating as a result of those queries? How much absolute overhead does each query have that could be obviated by batching these queries?
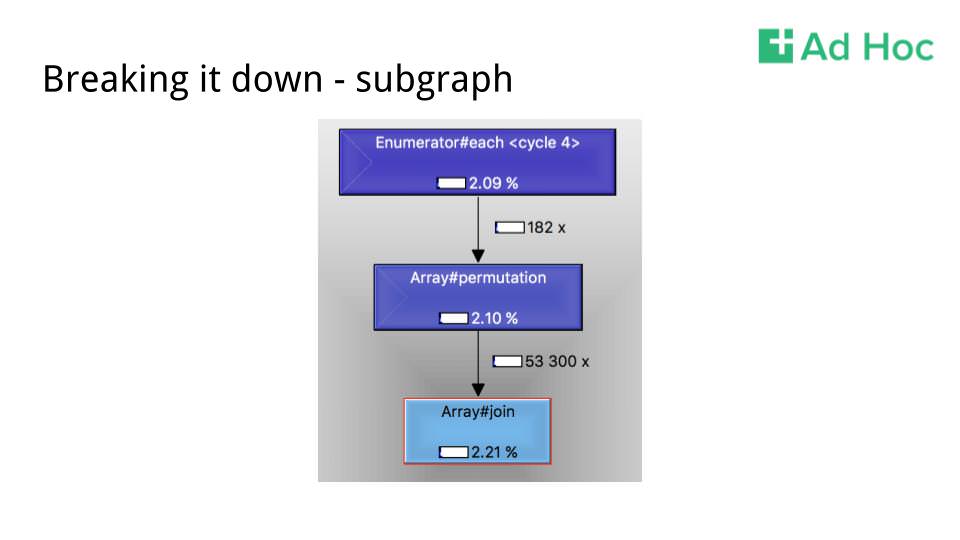
Moving on to the permutation call, why are we creating so many array permutations? This is not a rhetorical question, I literally have no idea what is going on here yet. I do, however, know that we are probably generating a ton of objects that the GC will have to clean up.
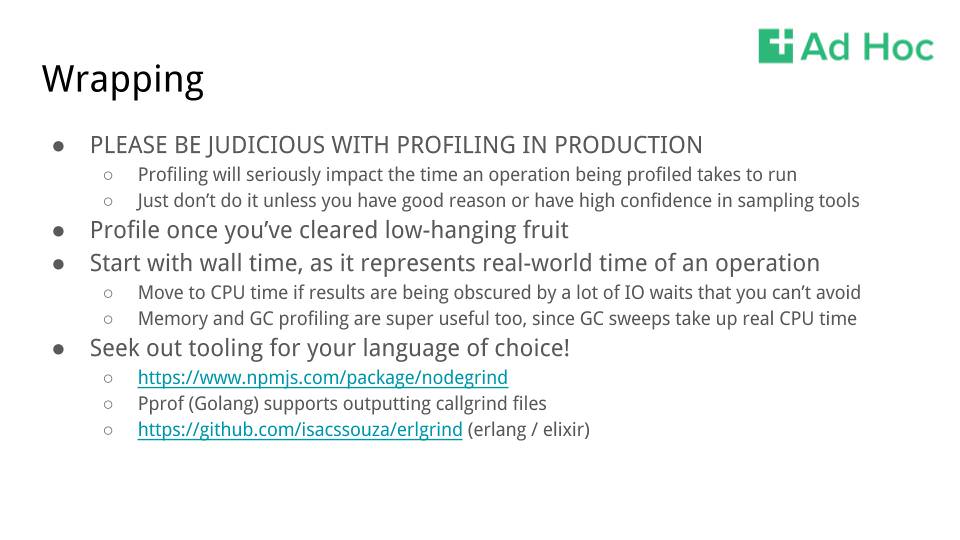
Wrapping:
- Please be judicious with profiling in production!
- Profiling will seriously impact the time an operation being profiled takes to run
- Just don’t do it unless you have good reason or have high confidence in sampling tools
- Profile once you’ve cleared low-hanging fruit
- Start with wall time, as it represents real-world time of an operation
- Move to CPU time if results are being obscured by a lot of IO waits that you can’t avoid
- Memory and GC profiling are super useful too, since GC sweeps take up real CPU time
- Seek out tooling for your language of choice!
See me on Twitter for any questions or comments. If you want to be a part of our next presentation, we’re hiring— join us!